

Check out the the other “Lightning Experience features” released in Winter’18.
This post specifically highlights the features of Lightning Report Builder released in Winter’18!
Introducing Lightning Report Builder

Lightning Report Builder : Differences Between the Lightning and Classic Report Builders
| Feature | Difference |
|---|---|
| Report Formats | In the Salesforce Classic report builder, you must choose a report format before grouping data.
In the Lightning report builder, the report format automatically updates as you group report data. Tabular, summary, and matrix reports are all available, but you don’t select the format before grouping the data. |
| Charts | The Lightning report builder features the same charts as the report-view-page in Lightning Experience. |
Add Tables with Up to 10 Columns to Dashboards
- The Lightning table, a new dashboard table component, shows up to 200 records and 10 columns from the fields available in a source report’s report type. (So the fields need not be added to the source report as columns!)
- Add a Lightning table to supplement chart and metric-based overviews with record-by-record details.
- Lightning tables are available in the dashboard builder by default. To turn off Lightning tables, go to the Reports and Dashboards Settings page in Setup and deselect Enable Lightning Dashboard Tables (Beta).
Embed Dashboards on the Home Tab and in Lightning Apps
- Embed dashboards using the Lightning App Builder. Customize the Home tab, or create a Lightning app, then drag-and-drop a dashboard component into place.
- Embedded dashboards aren’t available on record pages.
- Dashboards need space to display charts and tables. If an embedded dashboard is squished into too small a space, then a collapsed version displays instead of the full dashboard.
View Filtered Reports by Clicking Chart Segments from Dashboard
- For example, click the prospecting segment of an opportunity pipeline funnel chart to open and filter the source report by stage equals prospecting. This feature is new in Lightning Experience.

Get the Full Power of Enhanced Folder Sharing

Chart Enhancements for Reports and Dashboards
- Display Up to 500 Groups in Line and Bar Charts in Dashboards
- Add Up to Four Measures to Horizontal Bar and Stacked Horizontal Bar Charts in Dashboard Components
- Add a Second Line to a Line Chart
- Add Chatter Photos to Legacy Tables in the Lightning Dashboard Builder
- Add Conditional Highlighting to Legacy Tables in the Lightning Dashboard Builder
- Donut Charts Display Values or Percentages
- View Metric and Gauge Chart Numbers in Full, or Shorten Them; Show or Hide a Value Range
- Know When Data Limits Are Reached
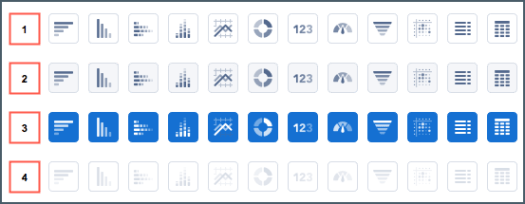
- Work Better with Redesigned Chart Icons

2 Replies to “Reports and Dashboards Enhancements – Released in Winter’18”